
Manufacturing plant optimization services are structured engineering programmes that measure how a plant actually performs, compare it with design and contractual targets, and fix the gaps in capacity, yield, energy use and equipment reliability. Most plants lose output not because of poor machines, but because nobody has a validated baseline to improve from.
India’s factories are adding capacity quickly. Capital goods output rose 16.1% year-on-year in July 2026, the fastest among all use-based categories, and 19 of 23 manufacturing industry groups grew, according to MoSPI’s quick estimate. Manufacturing itself expanded 7.3% in the month. New lines are being commissioned across the country, and each one carries a question: does it deliver the throughput the business case assumed?
The answer starts with post-commissioning performance validation services, which test the plant at design conditions and set the baseline that every later optimization effort is measured against. This article covers what optimization involves, which numbers matter in 2026 and how to sequence the work.
What Do Plant Optimization Services Cover?
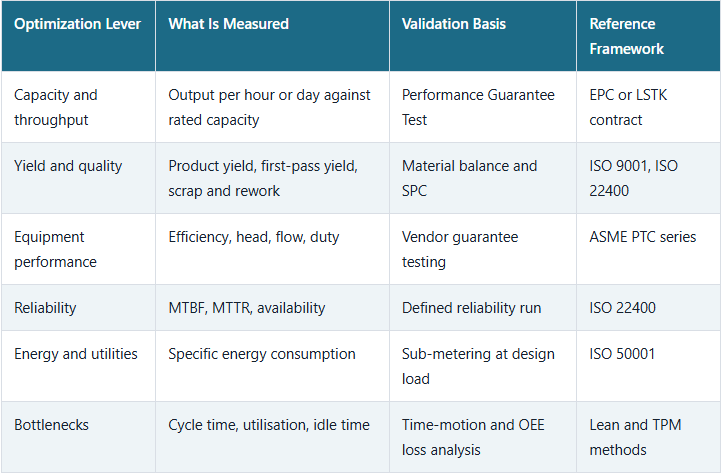
- Capacity and throughput: actual output against rated capacity.
- Yield and quality: product yield and first-pass yield.
- Equipment performance: efficiency of pumps, compressors, heat exchangers and reactors.
- Reliability: MTBF, MTTR and availability.
- Energy and utilities: specific energy consumption per unit of output.
- Bottlenecks: the stage that limits total plant throughput.
1. Start With a Validated Baseline
Optimization without a baseline is guesswork. Validation runs the plant at design conditions for a defined test period and measures capacity, yield, quality, utility use and reliability against contract Performance Guarantee Test (PGT) criteria. Statistical analysis of the data replaces single-point readings.
The stakes are financial as well as technical:
- EPC and LSTK payments and warranty release often depend on passing PGT.
- Liquidated damages may apply for capacity, consumption or quality shortfalls.
- Lenders may require validation before releasing the final tranche.
- State Pollution Control Board consent to operate typically needs compliance shown under real operating conditions.
2. Measure OEE Honestly
Overall Equipment Effectiveness (OEE) multiplies availability, performance and quality, and ISO 22400 defines it among 34 standard manufacturing KPIs. Most plants track only 6 to 10 of them.
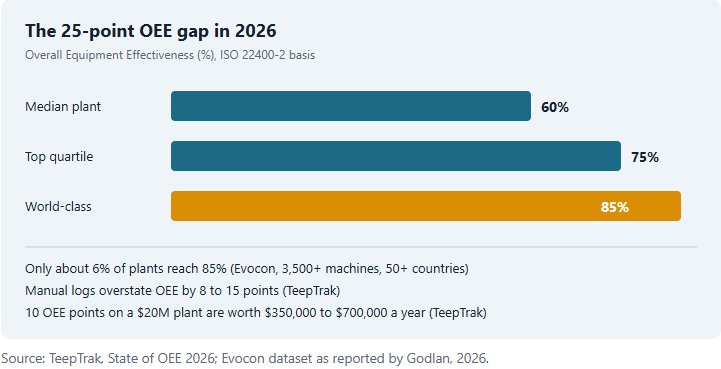
The 2026 benchmarks show how large the opportunity is. TeepTrak’s State of OEE 2026 puts median OEE near 60%, the top quartile near 75% and world-class near 85%. Evocon’s dataset of 3,500+ connected machines in 50+ countries found an average OEE of 55% to 60%, with only about 6% of manufacturers reaching 85%. Manual logs also overstate true OEE by 8 to 15 points, because short stops and speed losses go unrecorded.
3. Find the Bottleneck Before Buying Equipment
Bottleneck analysis identifies the stage that caps plant throughput. Time-motion studies, theoretical versus actual cycle times, equipment utilisation and idle time between stages reveal where output is lost. Typical causes include:
- Equipment running below rated speed
- Feed constraints or material shortages
- Changeover and inspection delays
- Steam, chilling or power limits
- Downtime frequency above the design assumption
Root cause tools such as 5-Why, Ishikawa diagrams, Fault Tree Analysis and SPC charts separate chronic design problems from one-off events, so money goes to the right fix.
4. Validate Energy and Utility Consumption
Utility cost compounds every year, so it deserves the same attention as capacity. Specific energy consumption (SEC) is measured in kWh per tonne, kcal per unit or GJ per tonne, and tracked against the design value in vendor and EPC guarantees. An SEC 5% to 20% above design flags an optimization opportunity.
Common causes of excess consumption include worn motors, oversized pumps, failed steam traps, compressed air leaks, poor insulation and idle equipment left running. Measure every utility together during the test, so one utility is not optimised at the cost of another. ISO 50001 provides the framework for tracking the baseline.
Plant Optimization Levers, Validation Basis and Reference Standards
5. Turn Findings Into Corrective Action and a Staged Ramp-Up
Once gaps are documented, corrective action may include equipment modification, process re-optimization, control tuning, SOP refinement or vendor claims where guarantees are missed. Every fix should be retested against the same indicators.
Ramp-up then raises operating rates in stages, with KPIs reviewed at each step. Evidence from 2026 shows the payoff. Godlan’s analysis of measured production lines found a median gain of 9.7 OEE points after structured improvement programmes, and TeepTrak reports documented paybacks of 3 to 12 months.
Consult IMARC Engineering for post-commissioning performance validation and improvement support: https://www.imarcengineering.com/contact?service=post-commissioning-performance-validation
6. Sustain Performance With Continuous Improvement
Validation is the start of optimization, not the end. Sustained programmes typically combine:
- Total Productive Maintenance for reliability
- Six Sigma projects for quality
- ISO 50001 energy programmes against the validated baseline
- Predictive maintenance in place of fixed-interval servicing
- Advanced process control for stable operation
Any deviation from the validated baseline should trigger an investigation, and benefits should always be quantified against that baseline rather than against generic targets.
How IMARC Engineering’s Expertise Can Help in Plant Performance Optimization
IMARC Engineering supports manufacturers, EPC contractors and project sponsors across the validation and optimization cycle:
- Scope definition and acceptance criteria aligned with contract guarantees
- Performance Guarantee Testing, capacity and throughput validation
- KPI assessment, OEE loss analysis and bottleneck identification
- Energy and utility consumption analysis and reliability testing
- Root cause analysis, corrective action and vendor claim support
- Staged ramp-up and continuous improvement planning
Read our detailed analysis here: https://www.imarcengineering.com/blog/how-to-validate-manufacturing-plant-performance-after-commissioning
Conclusion
Plant optimization delivers results only when it starts from a validated baseline. Manufacturers that test capacity, yield, energy use and reliability against design targets, then close the gaps in stages, protect their contractual position and lower operating cost. With 2026 benchmarks showing a 25-point OEE gap between typical and world-class plants, measured performance, not assumed performance, decides competitiveness. Plants that build validation into project planning will scale faster and enter every expansion with data, not estimates.
Frequently Asked Questions
What are manufacturing plant optimization services?
They are engineering programmes that compare actual plant performance with design and contractual targets, then correct gaps in capacity, yield, energy consumption and equipment reliability.
What is a good OEE for a manufacturing plant?
In 2026, median OEE is about 60%, the top quartile is near 75% and world-class is about 85%. The right target depends on product mix and changeover frequency.
How is plant performance validated after commissioning?
The plant runs at design conditions for a defined test period, and output, yield, quality, utility use and reliability are measured against Performance Guarantee Test criteria.
How much excess energy use signals an optimization opportunity?
Specific energy consumption 5% to 20% above the design value typically points to equipment inefficiency, process drift or utility losses worth investigating.
Contact Us:
IMARC Engineering
Phone: +91-120-433-0800
Email: sales@imarcengineering.com
India: C-130, Sector 2, Noida, Uttar Pradesh 201301
LinkedIn: https://www.linkedin.com/showcase/imarc-engineering/
About the Author