
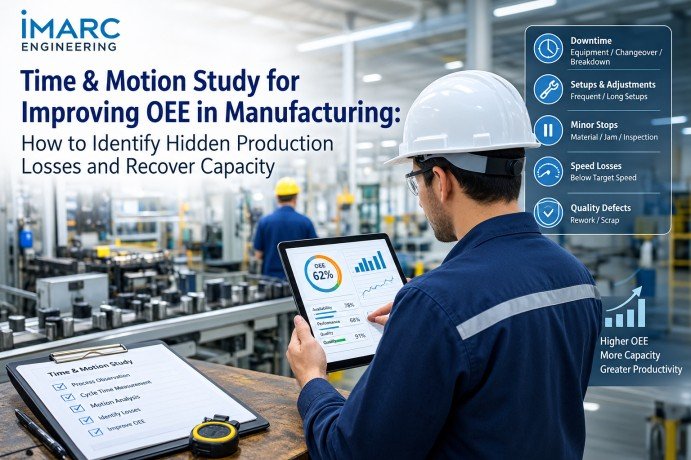
Time and Motion Study for OEE Improvement
Your OEE report says a line is running at 62%. It does not say why. Is an operator waiting for material? Is one station taking eight seconds longer than it should? Are short stoppages adding up unrecorded? A time and motion study for oee manufacturing answers these questions by measuring what actually happens at the workstation, machine and material-flow level. This article explains how to use one to find hidden production losses, recover capacity from existing assets, and judge whether new investment is truly needed.
By identifying cycle-time variations, idle periods, unnecessary movement, bottlenecks, and recurring micro-stoppages, manufacturers can pinpoint the root causes of lost capacity and improve throughput without immediately investing in additional equipment.
How Time & Motion Study Relates to OEE
OEE = Availability × Performance × Quality
- Availability: the share of planned production time in which equipment is actually available to run.
- Performance: actual production speed relative to ideal speed.
- Quality: good units as a share of total units produced.
OEE provides the performance framework; a time and motion study investigates the operational activities contributing to those losses. Time study measures how long each task, cycle and stoppage takes. Motion study examines the walking, reaching and handling behind those durations. OEE data sizes the loss; the study locates its cause.
How Time & Motion Study Helps Identify the Three OEE Loss Areas
Not every shop-floor delay maps neatly to one OEE component. Classification depends on how your plant defines planned and unplanned time, so agree those definitions first.
Availability
Depending on the plant’s OEE definitions, observation may reveal:
- Long or poorly sequenced setups and changeovers
- Waiting for maintenance, tools or material
- Slow restarts after breaks and shift handovers
Performance
This is where hidden capacity usually sits:
- Actual cycle time exceeding the ideal cycle
- Micro-stoppages that never reach the downtime log
- Excess operator movement and manual handling
- Operators waiting for machines, or machines waiting for operators
Quality
- Rework time and repeated inspection
- Defect-related interruptions
- Additional handling of suspect output
What to Measure During a Manufacturing Time & Motion Study
- Cycle time and task-level element times
- Takt time compared with actual cycle time, and demand rate compared with production rate
- Waiting and idle time for operators and machines
- Setup and changeover time, split into internal and external activities
- Operator movement, including walking distance and reach
- Material handling and feeding frequency
- Station utilization and WIP build-up between stations
These connect in one chain: customer demand sets takt time, takt time is compared with cycle time, cycle time determines line balance, and line balance shapes OEE and capacity. Record several shifts and operators, not one good hour. Variation itself is a finding.
What Data to Prepare Before the Study
- As much reliable historical OEE data as available, ideally covering multiple products, shifts and operating conditions. Where history exists, several months can reveal recurring patterns.
- Downtime and changeover logs, however incomplete
- Rated speeds and current standard times
- Layout drawings and material-flow routes
- Product mix, batch sizes and shift patterns
Incomplete logs are still useful. Gaps between recorded downtime and observed stoppages point to unrecorded losses. A new line without history can begin with rated speeds and direct observation.
How to Conduct a Time & Motion Study for OEE Improvement
- Set the objective. Target a specific line, product or loss.
- Gather OEE data. Identify the largest loss category.
- Select the process. Choose the bottleneck or lowest-performing station.
- Observe and record. Use direct observation, video or machine data, with operators informed.
- Measure cycle and task times. Classify activities as value-adding, necessary but non-value-adding, or avoidable.
- Quantify losses. Compare ideal, standard and actual cycle times.
- Improve the method. Redesign motions, layout, feeding or work distribution.
- Validate results. Re-measure OEE and cycle times after changes.
Findings become useful when tied to causes and actions:
| Finding | Likely root cause | Engineering action |
| Long cycle time | Excess manual motion | Method redesign |
| High idle time | Line imbalance | Work redistribution |
| Frequent minor stops | Material or tool access | Feeding and layout redesign |
| Long changeovers | Poor setup sequence | SMED-based redesign |
| Excess WIP | Bottleneck station | Line balancing |
How to Prioritize Which Production Loss to Study
Not every loss deserves study. Prioritize by:
- Constraint impact: gains at the bottleneck flow directly into plant output.
- Loss magnitude: the OEE category losing the most time.
- Repeatability: losses occurring every cycle offer more predictable gains than rare events.
- Financial and output impact: a two-second loss on a high-volume bottleneck can matter more than a ten-second loss on a low-volume process.
How Cycle-Time Losses Affect Manufacturing Capacity
Assume 420 minutes of uninterrupted production time, an ideal cycle of 30 seconds and an actual average cycle of 36 seconds.
- At 30 seconds: 840 units
- At 36 seconds: 700 units
- Gap: 140 units, a reduction of about 16.7% against the 30-second theoretical output
Six extra seconds look small on a stopwatch, yet across a shift they remove nearly one-sixth of theoretical output. The study’s job is to explain those six seconds: extra reaching, a poorly placed fixture, a wait for material, or a machine that idles while the operator finishes another task. These figures are illustrative and assume uninterrupted running.
How Line Balancing Can Improve OEE and Throughput
Four stations take 30, 31, 47 and 29 seconds. The line runs at the pace of the 47-second station, giving about 536 units in the same shift. Total work is 137 seconds; a theoretical balanced cycle would be 34.25 seconds, or roughly 735 units. Task precedence, equipment limits, operator skills and ergonomics often prevent perfect redistribution, so treat this as an illustration, not a target. A time study reveals which tasks make Station 3 slow, and whether any of them can move to a neighbouring station without breaking the process sequence.
How to Recover Hidden Capacity Before Buying Equipment
When demand rises, adding a machine or shift feels like the obvious answer. It is also expensive and slow. A study tests a prior question: how much capacity is already being lost inside the current process? Research on OEE management has highlighted that excess motion and processing within the assumed ideal cycle can hide capacity, especially in manual assembly and manually fed lines. If recoverable capacity covers the demand gap, expansion can be deferred or reduced.
A saved second matters only if it reaches output. After improvements, check:
- Bottleneck shift: removing one constraint exposes the next station.
- Upstream and downstream support: supply and packing must keep pace.
- Sustained standard work: documented methods and training prevent drift.
How Time & Motion Study Supports Automation Decisions
A study shows whether a task needs a robot, a fixture, a better layout or simply a better method. Strong automation candidates include:
- Repetitive, high-frequency tasks
- Activities with ergonomic risk
- Highly variable manual tasks affecting quality
- Quality-critical operations
- Labour-intensive bottlenecks
It also provides a baseline for checking automation payback.
Speak With An Expert: https://www.imarcengineering.com/contact?service=time-and-motion-studies
How Digital Time & Motion Studies Use MES, Machine Data and Video
Stopwatch studies capture a few hours of behaviour; machine data captures every cycle. Combine PLC and machine data, MES, OEE software and video observation with the time study. This gives a fuller picture than any single source, and it lets you check whether logged downtime matches what operators actually experience. Machine and MES data show when and how often losses occur; observation and video explain why.
KPIs to Measure Before and After the Study
Track OEE, availability, performance, quality, cycle time, takt time, throughput, changeover time, downtime, minor-stoppage frequency, labour productivity, machine utilization, WIP and first-pass yield. Follow one sequence: baseline, intervention, re-measurement. Without a baseline, an improvement cannot be demonstrated, and without re-measurement it cannot be trusted.
What Results to Expect
No universal OEE improvement percentage exists. Results depend on baseline OEE, loss profile, equipment condition, methods and corrective actions. Published cases are case-specific, not benchmarks. An apparel manufacturing study in Pakistan reported a 36% rise in average machine productivity, and a 2026 Indian lean case reported 20% lower fabrication time per unit.
When Should a Manufacturing Plant Conduct a Time & Motion Study?
- OEE stays low despite maintenance efforts
- A line cannot meet demand or takt time
- A new product or line is being introduced
- Brownfield expansion is under evaluation
- Automation investment is being justified
- The same bottleneck keeps returning
- Additional shifts, equipment or manpower are proposed to close a capacity gap
Common Mistakes That Weaken a Time & Motion Study
- Studying the wrong station. Improvements at non-bottleneck stations rarely lift output, because the constraint still sets the pace.
- Observing a single shift. Night shifts, new operators and product variants behave differently.
- Treating it as operator evaluation. Workers who feel judged change their pace.
- Using ideal cycle time as the only reference. The design cycle may contain avoidable motion.
- Skipping validation. Unmeasured improvements often fade over time.
How IMARC Engineering Can Help
IMARC Engineering helps manufacturers run time and motion assessments linked directly to OEE goals. Our experienced engineers establish current-state cycle times, identify bottleneck operations, analyze workstation loading, assess operator and machine utilization, trace material-flow losses, recommend line-balancing changes, estimate recoverable capacity, evaluate automation opportunities, and support brownfield capacity decisions. Every recommendation rests on measured data from your own production floor and shifts. To begin with facts rather than assumptions, request a manufacturing time and motion assessment from IMARC Engineering today.
Conclusion
OEE tells you that capacity is being lost; a time and motion study tells you where, why and how much can be recovered. Start with the bottleneck, establish a measured baseline, implement targeted changes, and validate the resulting OEE and capacity improvement. Involve operators throughout, since they know the workarounds that observers miss. Scope the first study narrowly, on one line or one specific loss, so that every major investment, expansion or automation decision rests on evidence rather than assumption.
Contact Us:
IMARC Engineering
Phone: +91-120-433-0800
Email: sales@imarcengineering.com
India: C-130, Sector 2, Noida, Uttar Pradesh 201301
LinkedIn: https://www.linkedin.com/showcase/imarc-engineering/
About the Author