
Introduction
Every rupee sitting in excess raw material, work-in-progress, or unsold finished goods is a rupee that cannot fund new equipment, new capacity, or new market expansion. For most Indian manufacturers, that trapped capital is larger than they realise.
At the same time, understocking can be equally costly. A single missed reorder point can halt a production line, delay a shipment, or cost a retail listing. Inventory optimization services help manufacturers strike the right balance between inventory availability and working capital efficiency.
MARC Engineering delivers inventory optimization and supply chain advisory services for manufacturers, FMCG companies, and exporters across India, combining demand forecasting, safety stock modelling, ABC-XYZ classification, and inventory policy design. This article explains why inventory optimization has become a board-level priority in 2026 and how a structured engagement is built.
Why Inventory Optimization Is Becoming Critical for Indian Manufacturers
India’s manufacturing base is expanding, but the cost of holding inventory has expanded with it. National data shows a supply chain that is improving in aggregate while remaining structurally expensive at the firm level.
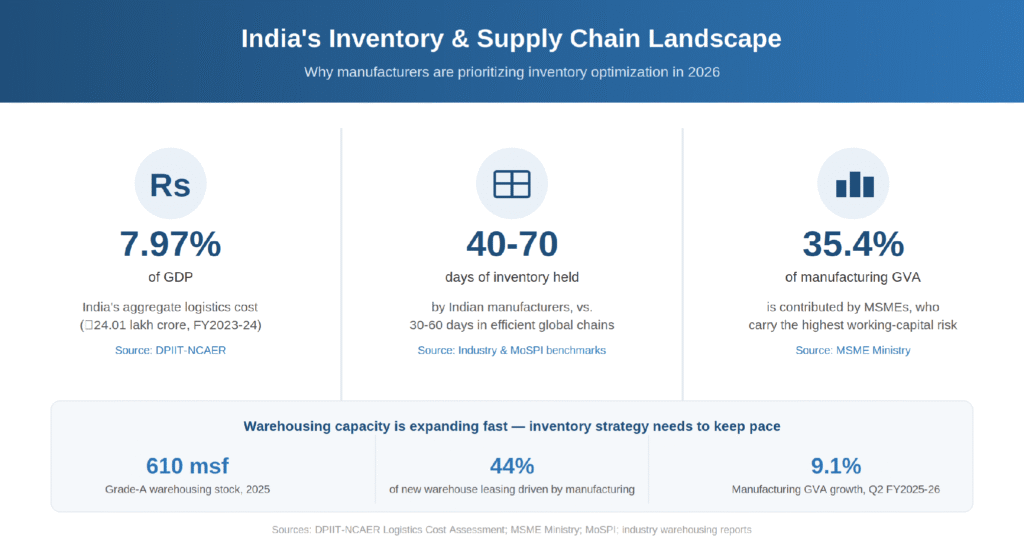
- Logistics cost: India’s aggregate logistics cost stands at 7.97% of GDP, or roughly ₹24.01 lakh crore for 2023-24, per a joint DPIIT-NCAER assessment.
- Inventory holding: Inventory holding periods vary significantly by sector, product complexity, supplier network, and demand volatility, making industry-specific inventory optimisation essential.
- MSME exposure: MSMEs contribute 35.4% of manufacturing Gross Value Added, per the MSME Ministry, and carry the highest working-capital sensitivity to inventory inefficiency.
- Manufacturing growth: Manufacturing Gross Value Added grew 9.1% in Q2 FY2025-26, per MOSPI’s quarterly GDP estimates, increasing throughput pressure on existing inventory systems.
- Warehousing expansion: India’s Grade-A warehousing stock reached roughly 610 million square feet in 2025, with manufacturing now accounting for 44% of new leasing demand.
The direction of travel is clear: manufacturing output, exports, and warehousing capacity are all scaling up. Inventory strategy has to scale with them, or working capital efficiency falls further behind operational growth.
The Core Problem: Why Poor Inventory Management Quietly Erodes Margins
Most companies do not experience inventory inefficiency as a single event. It shows up gradually, as tied-up cash, expired stock, missed deliveries, and reactive firefighting that never quite gets resolved.
- Excess working capital: Overstocking ties up cash that could otherwise fund capacity expansion, debt reduction, or working capital for growth.
- Frequent stockouts: Under-forecasted demand and inconsistent reorder points lead to production stoppages and missed customer commitments.
- Obsolescence and expiry: Materials with shelf-life constraints, particularly in pharmaceuticals and food processing, generate write-offs when stock levels are not tied to consumption reality.
- Reactive procurement: Without classification, buyers apply the same urgency to low-value items as to critical, high-risk materials, wasting management bandwidth.
- Seasonal misalignment: Festival-driven demand spikes and agricultural sourcing cycles catch unprepared companies with either too much or too little stock at the wrong time.
- GST and network inefficiencies: Poor inventory placement across multiple locations can increase logistics complexity and create avoidable tax and compliance challenges.
None of these problems are visible on a single balance sheet line. They surface only when inventory is analysed against actual consumption, lead time, and demand variability data, which is precisely what a structured optimization engagement is designed to do.
How Inventory Optimization Services Reduce Costs and Improve Supply Chain Performance
A properly structured inventory optimization service does not simply recommend lower stock levels. It rebuilds the logic that determines how much of each item should be held, and why.
Demand Forecasting and Classification
- Building statistical demand forecasts from historical consumption, adjusted for seasonality, festival calendars, and promotional uplift.
- Applying ABC classification by consumption value to identify the 10-20% of items driving 70-80% of inventory value.
- Layering XYZ classification by demand variability to flag which high-value items carry the greatest safety stock requirement.
Safety Stock and Reorder Point Modelling
- Calculating safety stock from actual lead time variability rather than assumed global benchmarks.
- Setting differentiated reorder points for critical, high-variability items versus stable, low-risk items.
- Incorporating supplier reliability data specific to India’s MSME-dominated raw material base.
Working Capital and Cost Impact
- Reducing carrying cost by eliminating excess stock in low-priority categories without increasing stockout risk.
- Freeing working capital that can be redirected toward capacity expansion, debt servicing, or growth investment.
- Improving service levels for critical materials by concentrating safety stock where it delivers the greatest risk reduction.
The combined effect is a shift from instinct-driven ordering to policy-driven ordering, where every stocking decision is traceable to a demand pattern, a lead time, and a defined service-level target.
Inventory Optimization: Approach Comparison
The table below contrasts an unstructured, instinct-driven inventory approach with a structured inventory optimization engagement across the dimensions that matter most to manufacturers.
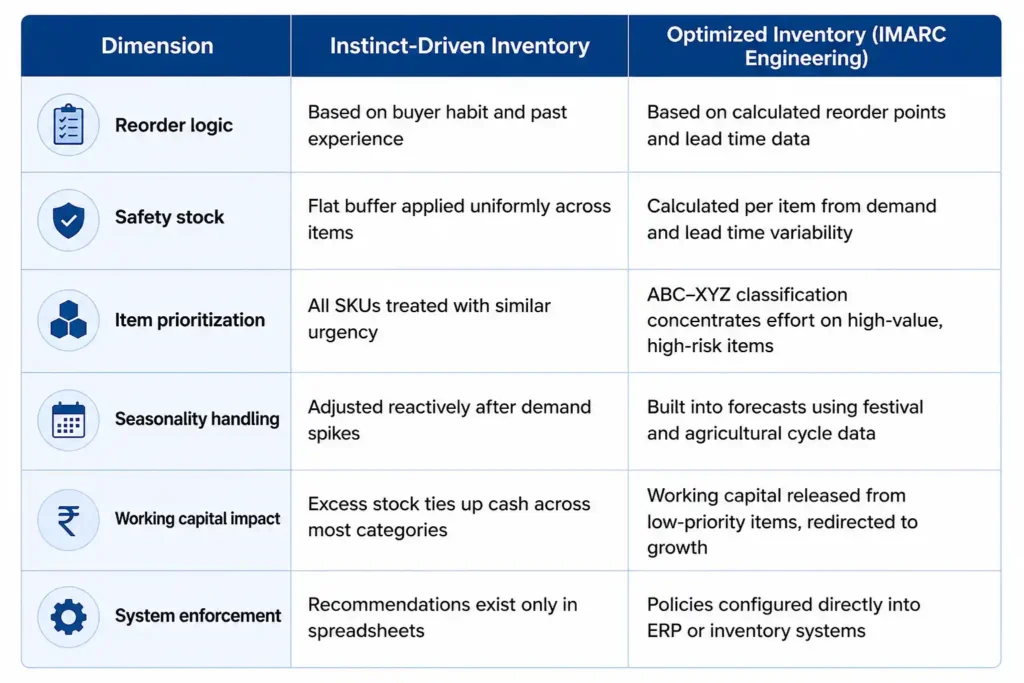
The gap between the two approaches is rarely about effort. Most procurement and planning teams work hard. The gap is about whether that effort is guided by data or by habit.
The IMARC Engineering Framework for Inventory Optimization
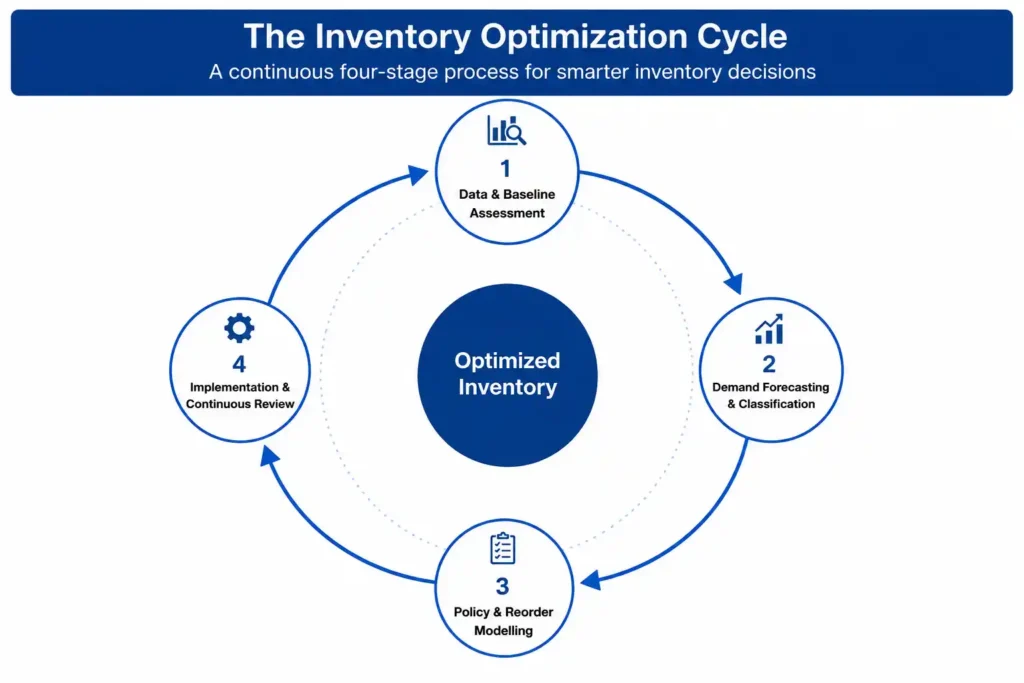
IMARC Engineering structures every inventory optimization engagement as a continuous cycle rather than a one-time diagnostic, so that policies stay accurate as demand and supply conditions change.
- Data and baseline assessment: Gathering historical consumption and procurement data, evaluating current inventory levels, and establishing measurable baseline metrics.
- Demand forecasting and classification: Building statistical forecasts and applying ABC-XYZ classification to segment materials by value and variability.
- Policy and reorder modelling: Calculating safety stock, reorder points, and order quantities calibrated to actual lead time and demand data.
- Implementation and continuous review: Supporting integration of inventory policies with existing ERP and inventory management systems, training procurement teams, and scheduling periodic recalibration.
This cyclical structure matters because supplier lead times, demand patterns, and GST regulations in India change continuously. A policy calibrated once and left untouched drifts out of accuracy within a few quarters.
Common Mistakes in Inventory Optimization
- Treating all SKUs equally: Applying the same reorder discipline to high-value critical items and low-value non-critical items wastes management effort and leaves real risk unmanaged.
- Using global benchmarks unmodified: Lead time and service level assumptions from North American or European supply chains understate the variability found in India’s MSME-driven supplier base.
- Ignoring seasonality: Applying flat safety stock models to categories with strong festival or agricultural-cycle demand swings creates avoidable stockouts or overstock.
- Skipping system implementation: Delivering optimization recommendations as a spreadsheet, without configuring them into the ERP or inventory system, allows ordering habits to revert within months.
- Overlooking GST implications: Structuring multi-location inventory without accounting for inter-state stock transfer and input tax credit rules adds avoidable tax cost.
- One-time analysis: Treating inventory optimization as a single project rather than a recurring review cycle allows policies to drift out of alignment with current demand and supply conditions.
About IMARC Engineering
IMARC Engineering is an engineering consulting and manufacturing advisory firm supporting manufacturers, FMCG companies, and exporters across India with end-to-end operational advisory.
The company’s Inventory Optimization Services cover demand forecasting, ABC-XYZ classification, safety stock calculation, reorder point definition, and inventory management system implementation across pharmaceuticals, food processing, chemicals, FMCG, and industrial manufacturing.
The firm’s approach integrates manufacturing operations knowledge with supply chain analytics, ensuring that inventory policies reflect real production consumption patterns and India-specific supply chain conditions rather than generic global assumptions.
Contact IMARC Engineering’s team for inventory optimization support across India: https://www.imarcengineering.com/contact?service=inventory-optimization-and-stock-planning
Conclusion
India’s manufacturing sector is scaling rapidly, supported by rising exports, expanding warehousing capacity, and strong policy momentum. But scale without disciplined inventory management simply multiplies the amount of working capital sitting idle in stock.
Inventory Optimization Services replace instinct-driven ordering with structured demand forecasting, ABC-XYZ classification, safety stock modelling, and system-driven inventory policies that reduce carrying costs while improving service levels and working capital efficiency.
Through this structured approach, IMARC Engineering helps manufacturers, FMCG companies, and exporters across India convert inventory from a source of hidden cost into a source of competitive advantage.
Contact Us:
IMARC Engineering
Phone: +91-120-433-0800
|Email: sales@imarcengineering.com
India: C-130, Sector 2, Noida, Uttar Pradesh 201301
LinkedIn: https://www.linkedin.com/showcase/imarc-engineering/