
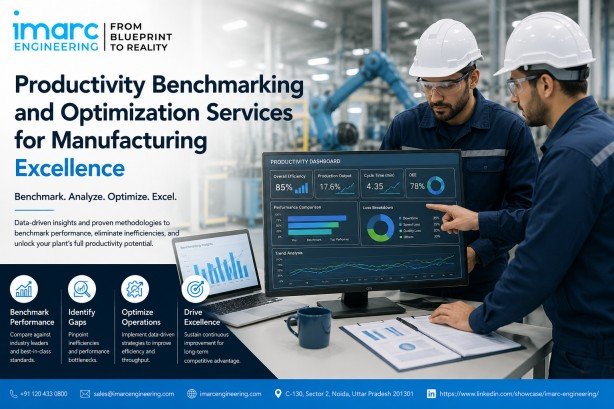
Manufacturing Productivity Benchmarking Excellence
A plant operating at 95% utilization can still underperform compared with one producing fewer units with lower overtime, downtime, and rejection rates. Output alone reveals little about operational efficiency. High-performing manufacturers understand how effectively their installed capacity, workforce, materials, and equipment capabilities translate into usable production. They measure where resources create value and where losses occur, providing a clearer basis for improving productivity, reliability, and overall plant performance.
This is the core problem that productivity benchmarking and optimization address: not simply asking, “How do we produce more?” but determining how much production capability already exists and where it is being lost. By comparing actual performance against capacity, labour productivity, material yields, equipment effectiveness, and industry benchmarks, manufacturers can identify hidden constraints, quantify performance gaps, prioritize corrective actions, and improve output without automatically adding resources or capacity.
Why Measuring Output Isn’t the Same as Measuring Productivity
Most manufacturing reviews stop at monthly production figures. But volume can rise even as the operation deteriorates , through excess overtime, higher rejection rates, more breakdowns, or growing work-in-progress. None of that shows in a simple output number.
Three related but different concepts get confused constantly:
- Productivity , output relative to the input consumed (units per labour hour)
- Efficiency , actual performance against an ideal or rated standard
- Utilization , how much of the available time or capacity was actually used
A plant can be efficient in bursts and still unproductive overall if utilization is poor. Treating these as interchangeable is a common reason improvement programs target the wrong lever.
The Layers a Real Benchmarking Exercise Has to Cover
Overall Equipment Effectiveness (OEE) is often used as shorthand for manufacturing performance , separating equipment losses into Availability, Performance and Quality rather than one number. But OEE is primarily an equipment-level measure, so it needs reading alongside plant-level capacity, labour, material, flow and financial indicators. In brownfield assessments, the largest constraint isn’t always the machine with the lowest OEE , a downstream inspection or packing step can constrain a whole line even when upstream equipment looks underutilized, which is why single-machine metrics need a full-line view.
A complete productivity picture requires benchmarking across several layers:
- Equipment productivity , OEE, availability, MTBF, MTTR
- Labour productivity , output per labour hour, manpower utilization
- Process productivity , cycle time, takt adherence, throughput, bottlenecks. Takt time is the pace of production required to meet customer demand; comparing actual cycle time against takt time shows whether a process can sustain that rate
- Material productivity , yield, scrap rate, rework
- Capacity utilization , actual output versus rated and theoretical capacity
- Flow efficiency , work-in-progress, queue time, movement
- Energy productivity , energy consumption per unit of output
- Financial productivity , conversion cost per unit, cost of downtime
Looking at any one in isolation gives a partial, sometimes misleading, picture. A plant can hit strong OEE numbers and still lose money on conversion cost because labour and energy productivity were never reviewed together.
There Is No Universal Benchmark , So Use Four Reference Points
One common mistake is chasing a generic “world-class” target , a fixed OEE percentage from a conference slide. OEE methodology cautions against one target across every process, industry and automation level. What fits a continuous-process chemical plant won’t fit a low-volume, high-mix line.
A defensible approach draws on four reference points instead of one:
- Internal , line vs line, shift vs shift, product vs product
- Historical , current vs previous quarters or pre-expansion baselines
- External , similar technologies or comparable plants in-sector
- Theoretical , actual vs design capacity and rated throughput
Using all four turns a single snapshot into a real gap analysis, with a target reflecting the plant’s own process reality rather than an imported number.
Finding Capacity That Already Exists
Before signing off on capex for a new line, it’s worth asking a more basic question: how much required output could be recovered from equipment already installed? A plant at 70% utilization isn’t automatically short of machinery , it may just be losing capacity across categories that were never added together.
For illustration, a plant with 1,000,000 units of installed annual capacity may produce only 700,000 because capacity is lost across downtime, reduced speed, changeovers, quality losses and scheduling constraints. These figures are illustrative only: each loss should be measured through the plant’s own data, not assumed to be a validated benchmark or treated as additive.
Addressing even part of this list can recover meaningful volume without touching the capital budget , which is why benchmarking should precede, not follow, an expansion decision.
From Installed Capacity to Demonstrated Capacity
Installed capacity is not necessarily what a plant can consistently deliver. A sharper assessment distinguishes rated, theoretical, demonstrated and sustainable capacity: rated reflects specifications on paper, demonstrated reflects what’s actually been achieved, and sustainable asks what output holds without excessive overtime or quality strain. This matters most in brownfield expansion, where decisions are often anchored to rated capacity when demonstrated capacity is the honest starting point.
Speak With An Expert: https://www.imarcengineering.com/contact?service=productivity-benchmarking-optimization
A Structured Framework, Not a One-Off Audit
Productivity gains that don’t persist usually fail because they were treated as a one-off event rather than a repeatable cycle. A structured approach moves through six stages:
- Measure , collect production, downtime, cycle time, rejection, labour and energy data for an honest baseline.
- Benchmark , compare against internal, historical, external and theoretical points.
- Diagnose , apply Pareto analysis, 5 Whys, fishbone analysis or time studies to find why each gap exists.
- Prioritize , rank by impact, investment and payback.
- Optimize , implement the changes the diagnosis points to.
- Sustain , build dashboards and review routines so gains don’t erode.
The distinction between stage two and three matters: benchmarking shows where the gap is; root-cause analysis shows why. Skipping straight from a gap to a fix is how improvement projects end up targeting symptoms instead of sources.
Where the Losses Actually Sit
Within the equipment layer, losses fall into six categories: equipment failure, setup/adjustment, idling and minor stoppages, reduced speed, process defects, and start-up/yield losses , mapping onto OEE’s three components: the first three hit Availability, the next Performance, the last two Quality.
Framed this way, “the line is inefficient” becomes something a team can act on: a specific loss, a root cause, a corrective action, an expected gain and the investment required.
Turning Gaps Into a Financial Case
A productivity gap only becomes decision-ready once expressed in financial terms. Downtime reduction converts into production hours and margin; scrap reduction into material savings; changeover reduction into available production time.
A useful business case quantifies impact across additional saleable units, material and labour-hour savings, avoided downtime and investment required , letting management compare a modest process fix against a much larger equipment purchase on equal footing, rather than defaulting to “buy new equipment.” Ranking initiatives by expected impact, investment, risk and payback often highlights lower-capital opportunities such as changeover reduction or bottleneck balancing before larger capacity additions, but the resulting priority is plant-specific.
Every improvement should also be tested for secondary effects: faster line speed can raise downstream congestion or defects if the constraint has simply moved, so each fix needs checking against the next station in the line.
| Productivity Gap | Indicator | Optimization |
| Equipment downtime | MTBF, MTTR | Maintenance strategy, reliability |
| Slow production | Actual vs ideal cycle time | Process optimization, line balancing |
| Changeover losses | Setup minutes | SMED, sequencing |
| Quality losses | Rejection, rework, FPY | Root-cause, process control |
| Labour imbalance | Output per labour hour | Workforce balancing |
| Material losses | Scrap, yield variance | Process/material optimization |
| Bottlenecks | Constraint throughput | Capacity balancing, layout redesign |
| Energy losses | kWh per unit | Utility efficiency |
Productivity Optimization for Greenfield, Brownfield and Existing Manufacturing Plants
A benchmarking exercise for a new greenfield plant looks different from an underperforming brownfield facility:
- New plants need capacity modelling and ramp-up benchmarks in design
- Brownfield expansions need bottleneck and hidden-capacity analysis before capital
- Underperforming plants need loss analysis on downtime, labour, quality
- High-growth operations need workforce and automation planning ahead of demand
- Multi-product plants need product-wise cycle time analysis, since a blended average hides real differences
Digital tools , MES, SCADA and ERP data on a common dashboard , support this, but only once the organization knows which loss it’s eliminating. Digitalization before diagnosis produces more data without clarity.
How IMARC Engineering Can Help
IMARC Engineering conducts structured productivity benchmarking and optimization studies for manufacturing plants across sectors , establishing baselines, applying internal, historical, external and theoretical benchmarks, and identifying root causes behind equipment, labour, material and capacity losses. Our teams translate each gap into a prioritized, financially quantified improvement plan covering process redesign, bottleneck elimination, maintenance strategy and workforce optimization. The objective is to determine whether existing assets can meet required output before committing capital, and where new investment is genuinely justified.
Conclusion
Productivity optimization isn’t about demanding more output from the same resources , it’s about locating where capacity, time, labour, materials and quality are being lost, quantifying what that costs, and converting it back into usable production. A plant that benchmarks properly, using the right reference points and a repeatable diagnostic cycle, often finds a meaningful share of its next expansion is already sitting inside the facility it operates today.
Contact Us:
IMARC Engineering
Phone: +91-120-433-0800
Email: sales@imarcengineering.com
India: C-130, Sector 2, Noida, Uttar Pradesh 201301
LinkedIn: https://www.linkedin.com/showcase/imarc-engineering/
About the Author