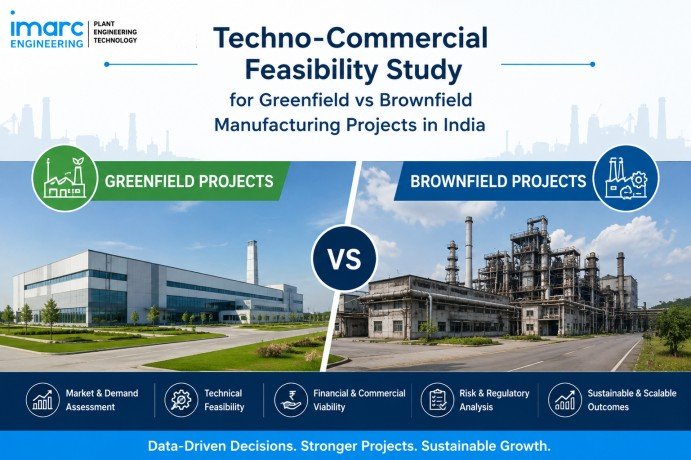
Most feasibility studies fail for a boring reason: they answer “greenfield or brownfield?” before anyone has properly diagnosed what the project actually needs. The format decision should be the output of a good study, not its starting assumption. Here’s how we actually run this analysis, with the current numbers that should be shaping it in 2026.
Manufacturing investments today demand more than cost comparisons or available land assessments. A robust techno-commercial feasibility study for manufacturing projects, evaluates production objectives, market demand, utility infrastructure, supply chain readiness, regulatory requirements, capital expenditure, operational efficiency, and long-term scalability. By assessing these factors together, businesses can determine whether establishing a new manufacturing facility or expanding an existing one delivers the strongest technical, financial, and strategic outcome while minimizing execution risks and improving return on investment.
Start With the Constraint, Not the Format
Before costing anything, three questions determine which format is even in play:
- Can the existing facility physically host the target technology? Not “is there floor space” ,whether structural load rating, utility supply, and process layout can take the new scope without a rebuild that’s greenfield in everything but name.
- What does the demand curve require, independent of which format is cheaper? Capacity plans sized to fit a convenient format instead of real demand routinely surface as an unplanned second expansion 12–18 months later.
- What does being wrong cost, on each path? Greenfield’s failure mode is a delayed clearance pushing back revenue. Brownfield’s failure mode is lost production on a live line. These are different risks, and collapsing both into one capex-per-unit number hides the thing that should actually decide the case.
The Cost and Timeline Data – With Ranges, Not Averages
The headline numbers get quoted constantly. What’s usually missing is the spread underneath them, which is where the real decision-making information lives.
Capital cost:
- Greenfield plant setup in India: $12M–$55M, a nearly 5x range
- Brownfield expansion: $6M–$22M, also close to a 4x range
- Brownfield delivers 40–60% lower CAPEX per unit of added capacity than greenfield
- Only around 14% of manufacturers globally now choose pure greenfield; the rest go brownfield or hybrid
Timeline:
- Greenfield, planning to full production: 3–5 years, roughly 6–12 months planning/design, 12–36 months construction and installation, 6–12 months commissioning
- Brownfield retrofit, start to finish: 6–18 months
- An existing facility running at 70–80% utilization can typically add a line and reach first output in 6–12 months
- Brownfield cuts overall project timelines by 30–50% versus greenfield
Execution risk (applies to both formats):
- Capital projects broadly run 60% over schedule and 70%+ over budget on average; large projects overrun by an average of $1.3 billion
- In India specifically, nearly 2,000 tracked infrastructure projects above ₹150 crore carried a cumulative cost overrun of roughly ₹5.66 lakh crore as of April 2026
The takeaway isn’t “brownfield is cheaper”, it’s that a study reporting a single capex figure with no named driver for where it could land within that range is an unfinished study. The useful version names the two or three variables that would push the number higher or lower — undocumented utility capacity on a brownfield site, land title complications on greenfield, equipment lead times , because those are what a project team can actually watch for once construction starts.
Regulatory Approvals and Timeline Assumptions
Environmental clearance is the single biggest swing factor in greenfield timelines, and the rules have moved recently enough that a study more than a few months old may be working from a stale baseline.
- Category A environmental clearance (central, via MoEFCC/EAC): 6–24 months from a complete application
- Category B1 projects (full EIA study required): 9–18 months
- Category B2 projects (no full EIA study): 3–6 months
- The Expert Appraisal Committee meets monthly — missing one cycle costs roughly four weeks
- A March 2026 MoEFCC draft amendment proposes new central bodies to step in where state-level clearance institutions (SEIAA/SEAC) are non-functional — aimed at fixing exactly the bottleneck responsible for many of the delays above
- January 2025 exempted industrial sheds up to 1,50,000 sq. m from environmental clearance entirely — a change many older feasibility templates still don’t account for
- March 2025 brought linear infrastructure (roads, pipelines, transmission lines) back under EIA regulation, reversing a 2020 exemption
Land acquisition and utility sanctioning, by contrast, have not gotten materially faster despite digital single-window tracking improving visibility into application status. A faster front door doesn’t fix a slow back office — and a study should model these separately rather than assuming digital reforms have compressed the real timeline.
The Incentive Layer-Why Date-Stamping Matters
PLI eligibility is not a fixed backdrop, and treating it as static is one of the more expensive mistakes we see in studies handed to us by clients after the fact.
- ₹2.16 lakh crore cumulative investment committed under PLI across 836 approved applications as of December 2025
- ₹20.41 lakh crore cumulative sales and ₹8.3 lakh crore cumulative exports generated under the scheme to date
- Incentive rates range 4–18% on incremental sales above a defined base year, varying by sector
- About 70% of PLI incentive payments to date have gone to electronics and pharmaceuticals , other eligible sectors (food processing, drones, advanced chemistry cells) remain under-penetrated relative to their allocated outlay
- 2026 is a transition year: original PLI windows are closing sector by sector even as successor frameworks ,including the Electronics Component Manufacturing Scheme and a proposed Component Manufacturing Scheme carrying a ₹22,919 crore outlay , come online with different localization thresholds and base-year benchmarks
A feasibility study that models incentive eligibility as a one-time check instead of a date-sensitive variable can misprice the entire economic comparison , sometimes by more than the capex gap between greenfield and brownfield itself.
Sector Signals Worth Building Into the Study
- Automotive and electronics led India’s industrial output growth in December 2025, at 33.5% and 34.9% respectively , much of this capacity addition is running through brownfield lines, putting the premium on independently verified asset condition rather than new-site screening
- FMCG companies with existing Indian facilities are treating brownfield as their primary vehicle for capacity addition in 2026, increasingly designed with export capability built in from the start
- Electronics and semiconductor-adjacent manufacturing pulled in a documented 28% surge in greenfield capex announcements in 2025 (to roughly $110 billion), making India the third-largest global recipient of greenfield FDI that year , because no retrofit closes a technology gap that requires a different building
- Pharmaceuticals and chemicals favor brownfield for speed, but GMP and effluent clearance requirements often demand near-greenfield levels of technical scrutiny on existing utility systems
Running the Comparison: What a Complete Study Actually Prices
A defensible study compares three configurations, not two:
- Pure greenfield — full design freedom, longest timeline, highest capital intensity, best fit when the technology ceiling of the existing facility is the binding constraint.
- Pure brownfield — fastest to output, lowest capex per unit of capacity, higher integration risk because the retrofit happens around a live production line.
- Hybrid — a new production hall built to greenfield-grade specification, sited on a footprint that retains existing utility and warehouse infrastructure. This captures most of greenfield’s technology ceiling at capital outlay much closer to brownfield’s, and it’s the option most template-driven studies never model, because they were never built to compare more than two options.
For each configuration, a complete study should deliver:
- A capex and timeline range, not a point estimate, with the specific risks that would push each toward its high or low case named explicitly
- Current-year regulatory clearance category and expected timeline range, dated to when the study was written
- Current-year incentive eligibility, checked against active scheme terms rather than terms from a prior cycle
- An explicit statement of what remains unverified at the time of the study — because studies that project certainty they don’t have are the ones that fail clients later, when a number that looked precise in the deck turns out to have been an assumption.
How IMARC Engineering Can Help
We run techno-commercial feasibility studies the way this article describes them: independently verified site and asset audits, not desk reviews of as-built drawings; capex and timeline ranges with named risk drivers, not single-point estimates; and regulatory and incentive positioning dated to when the study is delivered, checked against current EIA categories and active PLI-scheme terms. Where the data supports it, we model hybrid configurations alongside pure greenfield and brownfield options, so you’re comparing three real paths, not two. The result is a board-ready recommendation your team can act on with confidence, not a template with your project’s name on it.
Consult With An Expert: https://www.imarcengineering.com/services/feasibility-study-business-planning
Conclusion
The greenfield-versus-brownfield decision isn’t won by whichever format is cheaper on average, it’s won by matching the format to what the facility actually needs to do, priced honestly against India’s current regulatory timelines and incentive windows, not the ones that applied a year ago. A study that does this produces a recommendation a board can act on. A study that skips the ranges, the date-stamping, and the hybrid option produces a document that looks finished and isn’t.
Contact Us:
IMARC Engineering
Phone: +91-120-433-0800
Email: sales@imarcengineering.com
India: C-130, Sector 2, Noida, Uttar Pradesh 201301
LinkedIn: https://www.linkedin.com/showcase/imarc-engineering/
About the Author