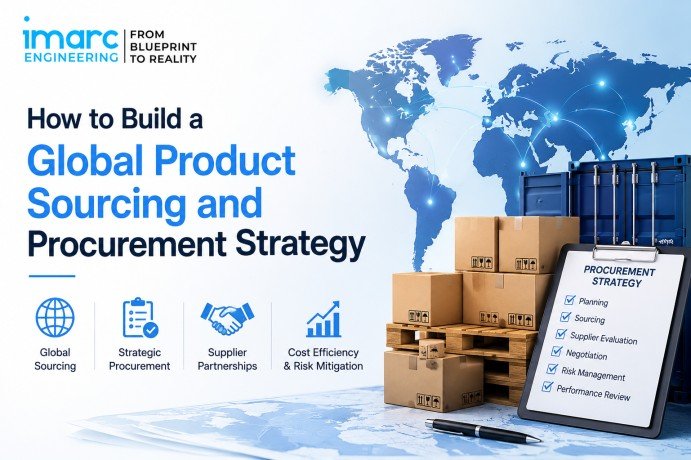
Many global product sourcing and procurement strategies underperform for a simple reason: they compare the wrong number. A team evaluates a new supplier in Vietnam or India against its incumbent in China on factory quote versus factory quote, sees a favourable spread, and moves. Eighteen months later the actual landed cost is worse than what they left behind, because duties, requalification, freight volatility, and upstream dependency never made it into the comparison.
That gap between the price on the quote and the total cost of operating that supply chain is the real subject of a sourcing and procurement strategy, and it’s exactly what Global Product Sourcing and Procurement Strategy services are built to close. Everything else, from country choice to contract structure, is downstream of getting that comparison right.
Why Factory Price Is the Wrong Starting Point
The cost of getting this wrong has risen through 2026. A few directional data points, treated as context rather than fixed inputs:
- Global container freight indices rose well over 40% year-over-year through mid-2026
- The U.S. raised tariffs on imported steel and aluminium to 50% ad valorem in April 2026
- U.S. International Trade Commission data cited in early-2026 sourcing analyses shows China’s share of U.S. imports fell roughly 16 percentage points between 2022 and 2025, while Vietnam’s rose about 38% and Mexico’s about 52%
- Duties on some Chinese-origin electronics and industrial goods now exceed 100% in certain categories, per the same analyses
Because trade policy moves quickly, verify current rates for your own product categories rather than modeling directly off these figures.
These numbers make diversification look obviously correct, but they hide what actually determines whether it works: what you’re diversifying away from often isn’t fully replaceable. A product assembled in India may still depend on Chinese-origin components or sub-assemblies, particularly where domestic supply-chain depth remains limited — LED drivers, precision aluminium extrusion, certain sub-assemblies — because that manufacturing depth hasn’t relocated, even where final assembly has.
The Four Numbers That Decide a Sourcing Move
- Landed cost, not factory price. Quote plus freight, duty, insurance, and currency exposure at today’s rates.
- Requalification cost. For regulated or safety-critical products, requalification (audits, testing, certification, validation) can be substantial; for simpler components it’s often modest. Either way, it belongs in the comparison from the start.
- Upstream concentration. What share of the new supplier’s own inputs still trace back to the country you’re diversifying away from? High share means you’ve added a step to the exposure, not reduced it.
- Ramp-to-volume timeline. The gap between “qualified” and “at full volume” is where disruption bites hardest, since it’s the window with no fallback capacity.
A supplier that wins on price but loses badly on the other three isn’t a diversification win — it’s a new single point of failure with better initial optics.
Segmenting Products and Geographies
- Prioritize components that are high-revenue, safety-critical, or single-sourced; deprioritize low-volume items where dual-sourcing costs more than the risk it removes
- Concentrate sourcing effort on the relatively small number of SKUs where supplier failure would have the greatest operational or financial impact.
- Evaluate geography against the specific product, not sourcing strategy in the abstract — a location strong in chemical processing may be weak in precision electronics
- Check trade-agreement access and infrastructure maturity per product rather than assuming a country-level answer applies across the whole catalog
Why China Plus One Does Not Always Reduce Risk
This is the most common blind spot in China Plus One planning, and it runs through three tiers:
- Tier 1 — final assembly. Usually what gets diversified first, and what shows up on a sourcing slide as “moved to India.”
- Tier 2 — component supplier. Sub-assemblies, drivers, and connectors feeding Tier 1 production frequently stay concentrated in the original country even after assembly relocates.
- Tier 3 — raw material supplier. Base metals, chemicals, and specialty inputs sit furthest upstream and are hardest to diversify.
Teams that diversify Tier 1 and stop there often believe they’ve diversified the risk, when it has simply moved upstream and out of view. A genuine strategy traces dependency through all three tiers, not just the tier on the contract.
Landed Cost, TCO, and a Supplier Scorecard
Landed cost is a start; total cost of ownership (TCO) goes further:
Factory price → Landed cost → Total cost of ownership
Total sourcing cost = purchase price + logistics + duties + insurance/inspection + qualification + quality failures/rework + inventory carrying cost + currency exposure + expedite costs + warranty/returns + switching costs
Treat this as a checklist, not a rigid formula — many sourcing decisions that look favorable on landed cost alone reverse once rework and carrying costs from longer lead times are added.
A weighted scorecard keeps comparisons consistent across a team:
| Factor | Suggested Weight |
| Total landed cost | 25% |
| Quality & technical capability | 20% |
| Supply capacity | 15% |
| Compliance & certifications | 15% |
| Lead time & logistics | 10% |
| Financial stability | 5% |
| Upstream concentration | 5% |
| ESG / sustainability | 5% |
Adjust weights by product risk — a regulated product should weight compliance and quality higher; a commodity component may weight cost higher. The value is in applying one consistent set of criteria, not the exact percentages.
Running the Supplier Selection Process
- Develop technical specifications
- Prepare RFQ/RFP with scope, volumes, and quality requirements
- Identify and shortlist qualified suppliers
- Issue RFQs and normalize quotations onto a common landed-cost/TCO basis
- Conduct factory audits and qualification checks
- Negotiate commercial terms
- Approve samples or run validation (e.g., PPAP) where applicable
- Award, finalize contract and SLA terms, and begin performance monitoring
Set commercial terms explicitly at negotiation — Incoterms (FOB, CIF, DDP can shift real cost and risk at the same headline price), MOQs, lead times, payment terms and currency, warranty, quality acceptance criteria, penalty/SLA clauses, and packaging and delivery terms — since these are the details that cause disputes when left implicit.
Continuous Supplier Monitoring
Annual supplier reviews are too slow to catch financial distress or capacity strain before it becomes a delivery failure. Track delivery performance, quality trends, financial health, capacity constraints and certification status for critical suppliers between formal review cycles, and broader signals such as capacity announcements affecting a supplier’s other customers. This is what separates teams that see disruption coming from teams that find out only after a missed shipment becomes a production disruption.
What’s Changed in 2026
- Compliance documentation is becoming a sourcing input. For products covered by regulations such as the EU Carbon Border Adjustment Mechanism (CBAM), emissions data and supplier documentation are increasingly becoming part of sourcing qualification alongside price, quality, and compliance capability.
- India’s sourcing ecosystem is strengthening across key manufacturing sectors. Production-linked incentives and continued investment in manufacturing and logistics infrastructure are expanding domestic capabilities across sectors such as electronics, pharmaceuticals, automotive components, textiles, and specialty materials. Improvements in freight and logistics connectivity are also strengthening India’s position as an alternative and complementary sourcing base within global supply chains.
- Supply-chain resilience is receiving greater weight in sourcing decisions. For critical and disruption-sensitive inputs, manufacturers are increasingly evaluating dual sourcing, supplier diversification, strategic safety stock, and upstream concentration alongside traditional cost and inventory-efficiency targets.
How IMARC Engineering Can Help
IMARC Engineering helps manufacturers evaluate and execute global product sourcing and procurement decisions using supplier qualification, landed-cost/TCO analysis, factory audits, upstream dependency mapping, and procurement coordination — aimed at finding sourcing options that are commercially competitive without hidden quality, compliance, or supply-chain risk.
- Landed-cost and TCO modeling beyond factory quotes
- Factory audits and supplier qualification against applicable standards
- Upstream mapping across Tier 1, 2, and 3 suppliers
- Geography-to-product fit analysis
- Continuous supplier risk monitoring
This support spans sectors including pharmaceuticals, chemicals, EVs, electronics, automotive and food processing, with recommendations grounded in project-specific requirements rather than generic country rankings.
Planning to diversify suppliers or build a global procurement network? Consult IMARC Engineering for supplier identification, qualification, landed-cost analysis, and procurement support.
Connect With An Expert: https://www.imarcengineering.com/contact?service=sourcing
Conclusion
A global product sourcing and procurement strategy is not a country choice or a supplier list. It’s a discipline for comparing true cost consistently, weighted toward the products where failure would actually hurt, run through a repeatable RFQ-to-award process, with qualification and compliance built in before the commercial decision — not after.
The highest-leverage first step isn’t picking a new country. It’s building the landed-cost and TCO model for your three or four highest-exposure SKUs and testing your current supplier against a genuine alternative on the four numbers, the scorecard, and the upstream-tier check above. That exercise alone usually shows whether your sourcing strategy has real gaps or just headline risk.
Contact Us:
IMARC Engineering
Phone: +91-120-433-0800
Email: sales@imarcengineering.com
India: C-130, Sector 2, Noida, Uttar Pradesh 201301
LinkedIn: https://www.linkedin.com/showcase/imarc-engineering/
About the Author