
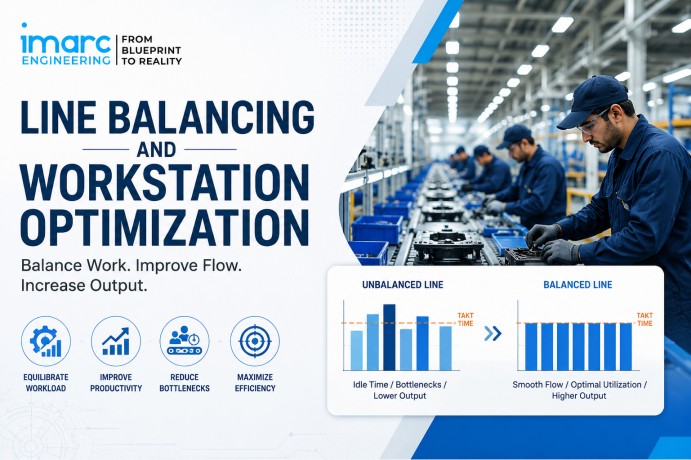
Line Balancing and Workstation Optimization
If your production line is missing output targets, the problem may not be a shortage of machines or people , it may be how work is distributed across existing stations. A handful of overloaded workstations can quietly cap the output of an entire line, even while other stations sit idle. This is the exact problem that line balancing and workstation optimization are designed to solve.
This guide walks through what line balancing means on the shop floor, how it connects to time and motion study, and how a manufacturer can use it to raise output before committing to new equipment or headcount.
What Is Line Balancing?
Line balancing is the process of distributing the total work content of a product across workstations so that workloads are aligned as closely as practical with the required cycle time, while respecting task precedence constraints. It’s worth noting that a line can still contain a constraint even after balancing , real production systems carry variability from downtime, quality issues, and other factors that balancing alone doesn’t remove.
The real question a line balancing exercise answers isn’t “how many people do we need?” It’s:
How should the required work be split across stations so the line produces at the rate the business needs, without wasting labour or machine capacity?
What Is Workstation Optimization?
Workstation optimization goes a step further than reassigning tasks. It looks at how work is performed at each station , layout, tool placement, material presentation, and operator movement , to remove friction that adds time without adding value. A station can be “balanced” on paper and still be inefficient if the operator has to reach, walk, or search unnecessarily to complete the job.
Why Time and Motion Study Comes First
Line balancing is only as good as the data behind it. Before tasks can be redistributed, you need an accurate picture of how long each element of work takes, based on measured observations and an appropriately calculated standard time , not an assumption.
A time and motion study typically records:
- Observed and normal time for each work element
- Performance rating and applicable allowances
- Value-added versus non-value-added activity
- Material handling, waiting, inspection, and rework time
- Operator movement and machine interaction
Without this data, line balancing becomes guesswork. Task reassignments based on assumptions rather than measured standard time tend to shift the bottleneck rather than remove it.
Takt Time vs Cycle Time
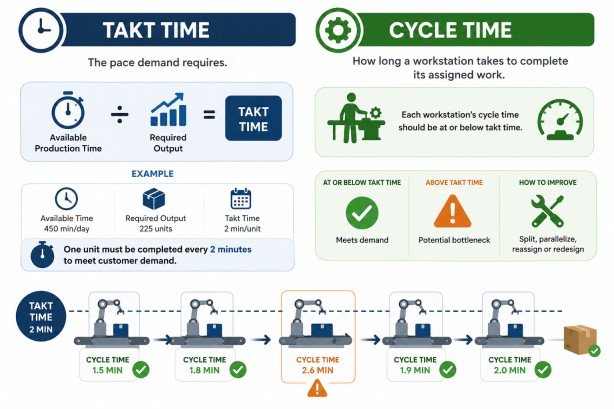
Time is the pace demand requires , how often one unit needs to come off the line to meet customer orders.
Takt Time = Available Production Time ÷ Required Output
For example, a plant running 450 minutes a day against a demand of 225 units needs to complete one unit every 2 minutes.
Cycle time is how long a workstation actually takes to complete its assigned work. For a line designed to meet demand, each workstation’s required cycle time should generally be at or below takt time. A workstation whose work content exceeds takt time can become a bottleneck unless the work is split, parallelized, reassigned, or otherwise redesigned.
How to Identify Bottlenecks
A structured, repeatable approach works better than trying to “eyeball” a slow station:
- Map the process from raw material to finished unit, station by station.
- Break each station’s work into elements , pick, position, assemble, fasten, inspect, move , rather than timing the whole station as one block.
- Conduct a time study across representative cycles, not a single observation.
- Establish standard time using rating and allowances.
- Calculate takt time based on current demand.
- Compare each station’s cycle time against takt time to flag stations that exceed it.
- Classify activity as value-added or non-value-added, since a station may exceed takt time purely because of avoidable waiting or motion, not genuine work content.
- Redistribute or restructure work at the constraint station, not across the whole line indiscriminately.
The goal is to fix the constraint, not to make every station marginally busier , improving a non-bottleneck station rarely changes total output.
A Practical Example
Consider a line with a required takt time of 45 seconds:
| Workstation | Work Content |
| WS1 | 42 sec |
| WS2 | 68 sec |
| WS3 | 38 sec |
| WS4 | 44 sec |
| WS5 | 31 sec |
WS2, at 68 seconds, exceeds the 45-second takt time and becomes the constraint , regardless of how much spare capacity WS3 and WS5 have. Balancing would involve moving selected work elements out of WS2 toward stations with capacity to absorb them, splitting WS2 into two stations, or redesigning the task itself, until WS2’s content is brought closer to takt time. (This is an illustrative example, not an actual project result.)
Key Metrics Worth Tracking
- Line efficiency , Total Work Content ÷ (Number of Workstations × Line Cycle Time) × 100. The cycle time here refers to the design cycle time used for the balancing calculation, not necessarily the actual time at every station.
- Balance delay , the proportion of available capacity lost to uneven task distribution; under the same assumptions, it is generally the complement of line efficiency.
- Idle time , time an operator or machine is available but has no work due to upstream or downstream constraints.
- Workstation utilization , how much of a station’s available time is spent on productive work.
- Throughput , the number of good units the line produces per hour or shift, the metric management ultimately cares about.
Line Balancing Methods
- Ranked Positional Weight (RPW) , tasks are ranked by positional weight, generally based on a task’s own processing time plus the processing times of the tasks that succeed it in the precedence network.
- Largest Candidate Rule (LCR) , tasks are ranked by processing time and assigned subject to precedence and cycle-time constraints.
- Kilbridge & Wester method , organises tasks by precedence “columns.”
- Heuristic and computer-based methods (e.g., COMSOAL) , used when the number of possible task combinations is too large to balance manually.
- Mathematical optimization models , applied when multiple constraints, such as ergonomics or several product variants, need to be balanced simultaneously.
Layout, Manpower, and Ergonomics
Rebalancing tasks is only one lever available:
- Layout , reducing walking distance, improving material presentation, positioning tools within easy reach.
- Manpower , cross-training operators, adding a second operator to a genuine bottleneck, or combining under-utilised stations.
- Equipment , parallel machines, additional fixtures, or targeted semi-automation at the constraint point.
- Ergonomics , reducing awkward reach, repetitive strain, and excessive lifting, since a station that meets takt time but exhausts its operator is not a sustainable fix.
Single-Model, Multi-Model, and Mixed-Model Balancing
- Single-model balancing applies to one standardised product on a dedicated line.
- Multi-model balancing deals with multiple product models sharing production resources, with differences in work content and processing requirements; depending on the system, models may be produced in batches or according to a defined sequence.
- Mixed-model balancing typically addresses the sequencing of different product variants on the same line, often produced in an interleaved sequence rather than large batches.
Manufacturers in sectors such as automotive components, electronics, and appliances may operate multiple product variants on shared lines, which adds complexity to the balancing exercise and needs to be reflected in the study rather than assumed away.
What Data Is Required for a Line Balancing Study?
A credible study is built on engineering data, not a spreadsheet exercise. Typical inputs include production volume and demand, available production time, product routing and process sequence, measured work elements and standard times, applicable allowances, operator count, machine availability, changeover time, product variants, rework or quality data, and the existing workstation layout.
When Should a Manufacturer Conduct a Line Balancing Study?
Common triggers include:
- Production consistently misses target
- One workstation repeatedly becomes a bottleneck
- Operators carry visibly uneven workloads
- Work-in-progress accumulates between stations
- A new product or variant is being introduced
- Production volume is increasing
- A new line is being designed
- Plant expansion is under consideration
- Labour cost per unit is rising
- Existing machines appear underutilised
- Automation or capital expenditure decisions are being evaluated
Common Mistakes to Avoid
- Balancing against average cycle time instead of measured standard work content.
- Ignoring task precedence constraints when reassigning work.
- Optimising individual stations instead of the line as a whole.
- Relying on outdated time-study data after a product or tooling change.
- Adding manpower before the actual bottleneck has been identified.
- Automating a task before eliminating the waste built into it , automation locks in inefficiency just as effectively as it locks in speed.
Why Line Balancing Should Be Done Before Approving New Capital Expenditure
A common assumption when output falls short of demand is that the plant needs another machine or additional headcount. A structured line balancing study often reveals a different picture: one bottleneck station, idle capacity elsewhere, and work content that hasn’t been reassigned since the process was first set up. In many cases, existing installed capacity can absorb a meaningful part of the shortfall through better task distribution alone , before capital spend is committed.
How IMARC Engineering Can Help
IMARC Engineering supports manufacturers through the full sequence , time and motion study and standard time development, takt time analysis, bottleneck identification, line balancing, and workstation layout and ergonomic review. This applies equally to improving an existing line and to designing a new one around a target time for a greenfield or brownfield project. For manufacturers experiencing uneven workloads, bottlenecks, excess operator idle time, or capacity constraints, a structured time and motion study can establish whether the root cause lies in work content, workstation design, manpower allocation, or line configuration , before further capital is committed.
Consult With An Expert: https://www.imarcengineering.com/contact?service=time-and-motion-studies
Conclusion
Line balancing and workstation optimization address a problem that’s easy to misdiagnose: a shortfall in output that looks like a capacity problem but is actually a distribution problem. Getting it right starts with accurate time and motion data, a clear takt time target, and a disciplined process for finding and fixing the actual bottleneck , not the station that happens to be easiest to change. Done properly, line balancing and workstation optimization can, in suitable cases, raise throughput without a corresponding increase in labour or machine investment, which makes it worth evaluating before, not after, the capital budget is approved.
Contact Us:
IMARC Engineering
Phone: +91-120-433-0800
Email: sales@imarcengineering.com
India: C-130, Sector 2, Noida, Uttar Pradesh 201301
LinkedIn: https://www.linkedin.com/showcase/imarc-engineering/
About the Author