

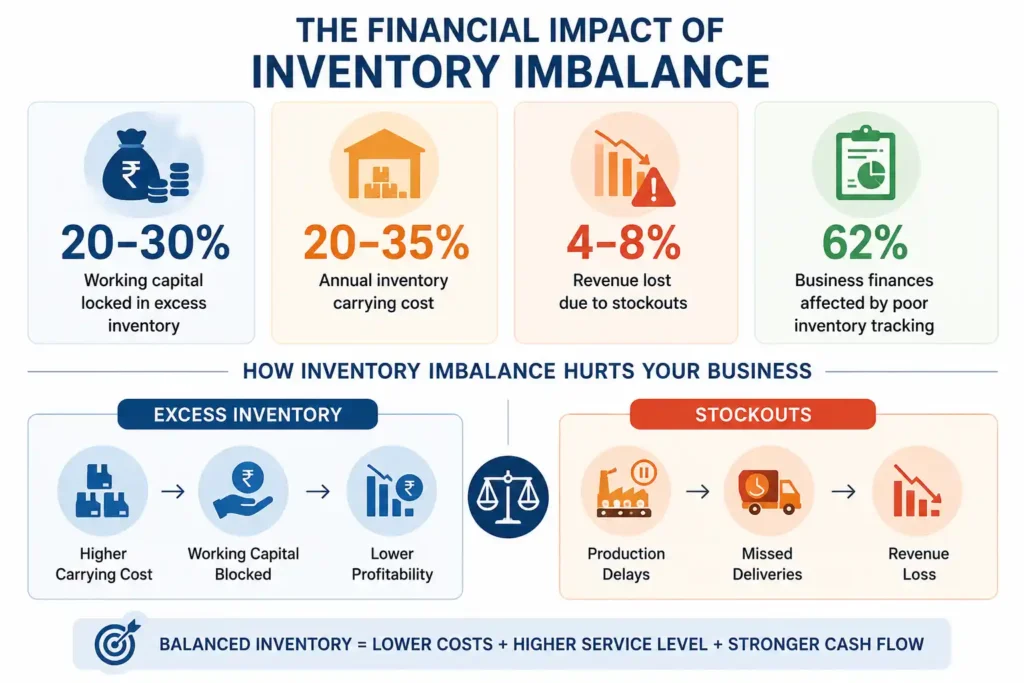
Inventory is one of the largest investments on a manufacturing balance sheet, yet it is also one of the least optimized operational assets. Most manufacturers have 20 to 30% of their working capital tied up in excess inventory, and carrying costs alone can consume up to 35% of total inventory value each year.
At the other extreme, stockouts cost manufacturers an estimated 4 to 8% of annual revenue through lost production, expedited shipping, and missed delivery commitments. For Indian factory owners running multi-shift operations with long raw material lead times, this is not an abstract efficiency metric, it is capital sitting idle on one side of the plant while a stalled assembly line bleeds money on the other.
IMARC Engineering’s inventory optimization and stock planning engagements typically begin by quantifying exactly where a facility sits between these two failure modes before recommending any system change.
Why Inventory Imbalance Is a Structural Problem, Not a Procurement One
Carrying costs typically run 20 to 35% of inventory value per year, covering storage, insurance, depreciation, and the opportunity cost of capital that could otherwise fund equipment upgrades or expansion. This means a factory holding ₹5 crore in average inventory could be absorbing ₹1 to 1.75 crore annually just to keep that stock on shelves, regardless of whether it ever gets used. An effective Inventory Optimization and Stock Planning strategy addresses these structural inefficiencies by aligning inventory levels with operational and market realities.
The imbalance compounds because manufacturing inventory sits in three distinct pools, each with different risk profiles:
- Raw materials, exposed to supplier lead time variability and price volatility
- Work-in-progress (WIP), which ties up capital mid-process and signals bottlenecks when it accumulates
- Finished goods, which carry obsolescence risk if demand forecasts miss
Roughly 62% of business finances are affected in some way by failures in inventory tracking, which explains why plants with accurate, real-time visibility into all three pools consistently outperform those relying on periodic manual counts.
Demand Forecasting: The Foundation of Effective Inventory Planning
Inventory optimization starts before a single reorder point is calculated. Applying AI-driven or statistically rigorous demand forecasting can cut forecast errors by 20 to 50%, and reduce lost sales and product unavailability by as much as 65% compared to static, spreadsheet-based planning. For manufacturers with long raw material lead times, this matters disproportionately, since a misjudged forecast six months out either strands capital in unused components or idles an assembly line waiting for a critical part.
Effective forecasting for a manufacturing plant typically layers three inputs:
- Historical consumption data, adjusted for seasonality and known demand shifts
- Supplier lead time variability, particularly for imported components subject to customs delays
- Production schedule alignment, ensuring purchasing cycles match actual line utilization rather than nominal capacity
ABC Analysis and SKU-Level Prioritization
Not all inventory deserves the same attention, and treating it uniformly is one of the most common sources of waste. In most manufacturing operations, A-category items account for just 10 to 20% of SKUs yet represent 70 to 80% of total inventory value. Applying differentiated control to this tier, tighter safety stock calculations, more frequent reviews, and closer supplier coordination, delivers the largest share of savings from a limited planning effort.
A practical ABC-driven stock planning framework typically applies:
- A items: weekly or biweekly review cycles, tight safety stock bands, and dedicated supplier relationship management
- B items: monthly reviews with moderate safety stock buffers
- C items: quarterly reviews with simplified reorder rules, since the capital at risk is comparatively small
SKU rationalization, reviewed at least twice a year or quarterly in fast-moving categories, complements this by identifying slow-moving or obsolete components before they accumulate as dead stock on the balance sheet.
Safety Stock and Reorder Point Calculation
Safety stock is the buffer that absorbs demand spikes and supplier delays, but calculating it incorrectly is expensive in both directions. Common service level targets vary by product criticality:
- 95% for standard production components
- 99% for customer-committed or contractually obligated production
- 85 to 90% for new or highly variable-demand products
The standard reorder point formula, demand during lead time plus safety stock, works only when lead time variability is tracked accurately rather than assumed constant. For components with long or inconsistent lead times, particularly imported electronics, specialty alloys, or process chemicals subject to regulatory clearance, the safety stock calculation must weight demand variability as heavily as lead time itself, not treat lead time as the sole driver.
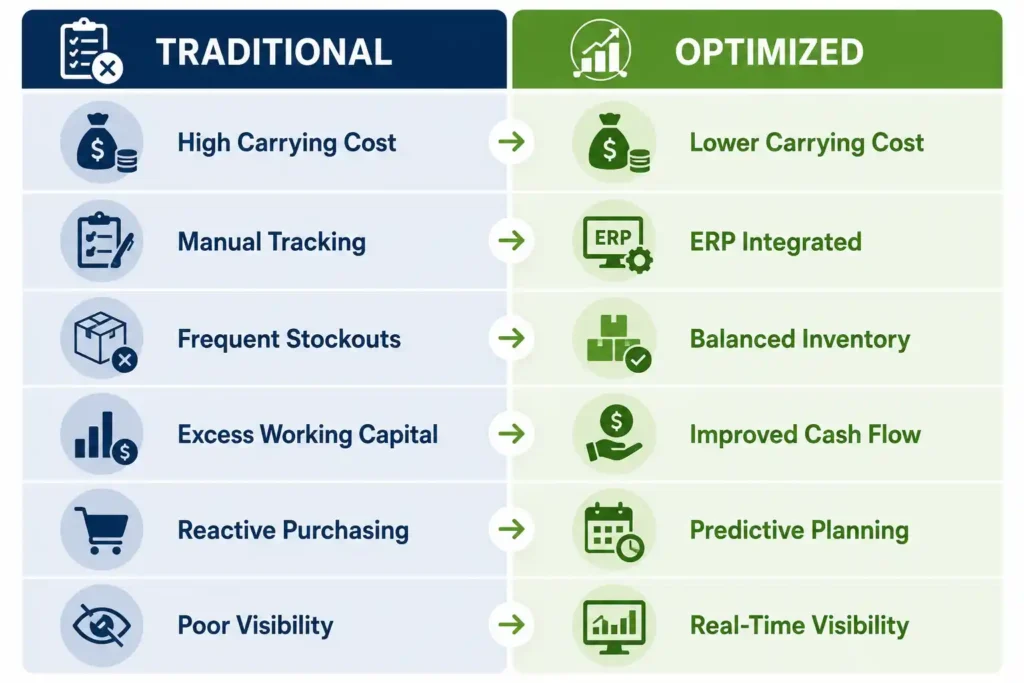
Traditional Inventory vs Optimized Inventory
Kanban and Pull-Based Replenishment on the Shop Floor
Push-based ordering, where purchasing decisions are driven by forecasts rather than actual consumption, tends to accumulate a buffer of just-in-case stock that never gets used. Kanban systems replace this with pull-based replenishment, triggering purchase or production orders only when inventory is genuinely consumed. Manufacturers implementing kanban pull systems typically achieve inventory reductions of 20 to 50%, without increasing stockout risk, because replenishment now tracks real consumption rather than forecast error.
For Indian plants running mixed manual and digital shop floors, this often means a phased rollout: physical kanban cards for high-turnover commodity components, paired with digital reorder triggers integrated into the plant’s ERP for higher-value or longer-lead-time items.
Inventory Turnover Benchmarks by Component Type
Turnover targets are not universal, and applying a single benchmark across an entire parts catalogue misallocates review effort. Reasonable turnover benchmarks by component category include:
- Commodity components with stable demand: 6 to 12 turns per year
- Application-specific or specialized parts: 3 to 6 turns per year
- Custom or long-lead-time components: 1 to 3 turns per year
Tracking Days Inventory Outstanding (DIO) alongside turnover gives a clearer read on efficiency, since a lower DIO signals faster conversion of held inventory into completed production, directly reducing the holding cost burden calculated earlier.
How IMARC Engineering Supports Inventory Optimization and Stock Planning
Translating these frameworks into a working system on an actual Indian factory floor requires more than a formula, it requires reconciling ERP data quality, supplier lead time realities, and production scheduling constraints simultaneously. IMARC Engineering supports manufacturing clients through:
- Inventory and SKU audits, establishing accurate baseline data on carrying costs, turnover ratios, and dead stock exposure before any system redesign begins
- ABC and demand variability classification, tailoring review cycles and safety stock policy to each SKU tier rather than applying blanket rules
- Reorder point and safety stock modelling, calibrated against actual supplier lead time data rather than assumed averages
- Kanban and pull-system design, phased for plants transitioning from manual to digitally triggered replenishment
- ERP and planning tool integration, ensuring reorder logic, production scheduling, and procurement data stay synchronized rather than operating in separate spreadsheets
Organizations that deploy automated replenishment or structured planning commonly report inventory reductions in the 10 to 30% range, freeing working capital that would otherwise sit idle on warehouse shelves. The engagement also includes supplier performance analysis, inventory policy reviews, and planning process improvements to ensure long-term inventory accuracy and supply chain resilience.
Speak with IMARC Engineering’s Inventory Optimization Specialists: https://www.imarcengineering.com/contact?service=inventory-optimization-and-stock-planning
Business Benefits of Inventory Optimization
The financial case for structured inventory optimization compounds across three levers simultaneously: carrying cost reduction, stockout avoidance, and working capital release. A plant that cuts excess inventory by even 15%, while holding stockout risk constant, typically frees enough working capital to fund a meaningful equipment upgrade or expansion line without new borrowing. Firms with mature inventory practices report inventory record accuracy levels of up to 95%, which directly reduces the emergency replenishment costs, expedited freight charges, and production downtime that erode margins in less disciplined operations.
Conclusion
Inventory optimization is shifting from periodic cleanup exercises to a continuous, data-driven discipline embedded in daily plant operations. As supply chains remain exposed to raw material volatility and lead time uncertainty through 2026, manufacturers with accurate SKU-level visibility and calibrated reorder logic will absorb disruptions with far less capital strain than those still relying on static forecasts.
Manufacturers that continuously align inventory policies with demand, supplier performance, and production schedules will be better positioned to improve working capital efficiency, increase operational flexibility, and respond more effectively to future supply chain disruptions.
Contact Us:
IMARC Engineering
Phone: +91-120-433-0800
Email: sales@imarcengineering.com
India: C-130, Sector 2, Noida, Uttar Pradesh 201301
LinkedIn: https://www.linkedin.com/showcase/imarc-engineering/
About the Author