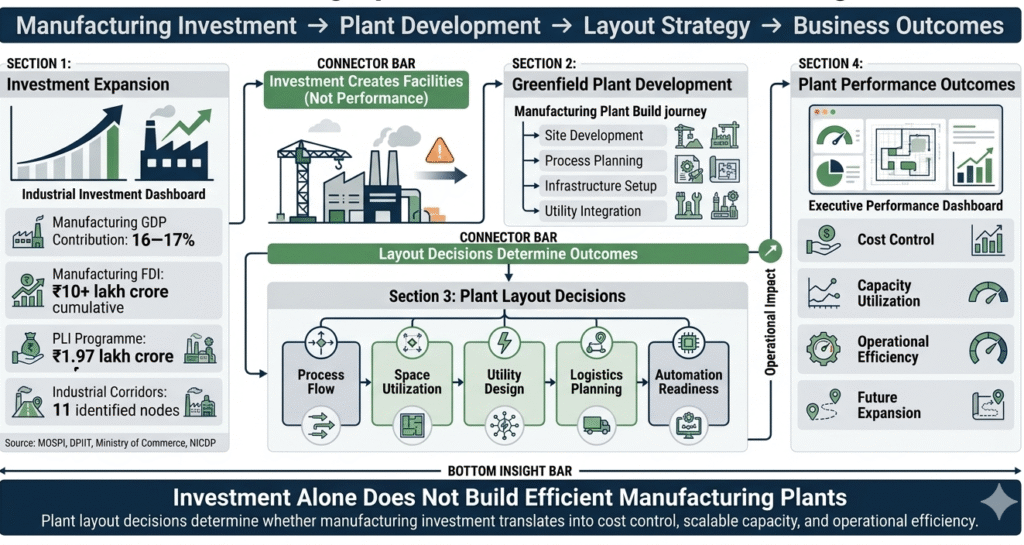
India’s manufacturing sector contributes approximately 16–17% of GDP, according to MOSPI national accounts data. The Government’s stated target under the National Manufacturing Policy is to raise that share to 25% of GDP a structural shift that requires not just more factories, but better factories.
DPIIT data shows that manufacturing has consistently been among the top three sectors for FDI equity inflows, with cumulative inflows crossing ₹10 lakh crore over the last two decades. The Production Linked Incentive (PLI) programme, covering 14 sectors with an approved outlay of approximately ₹1.97 lakh crore, is now accelerating greenfield facility investment across electronics, pharmaceuticals, food processing, textiles, and capital goods.
The National Industrial Corridor Development Programme (NICDP) has identified 11 industrial corridor nodes across the country, creating dedicated land parcels for new manufacturing units. Invest India data indicates strong project pipeline activity across these nodes.
But here is the critical gap most investors miss:
More investment in a greenfield plant does not automatically produce an efficient plant.
The plant layout design how production flow, space, utilities, and logistics are organized determines whether that investment translates into cost control, capacity utilization, and sustained operational performance. Layout decisions made in the design phase lock in cost and efficiency outcomes for 15–25 years.
Why Plant Layout Decisions Matter More Than Construction Cost
Construction cost is a one-time event. Layout consequences are permanent.
A poorly designed production flow will generate excess material travel distance, estimated at 20–40% of non-value-adding time in Indian manufacturing facilities studied under the National Productivity Council framework. A building that cannot be expanded without demolishing utility infrastructure forces costly retrofits.
DATA SNAPSHOT
| Metric | Operational Impact |
| Material travel distance per shift | Directly proportional to WIP inventory and lead time |
| Space utilization rate | Industry benchmark: 65–75% usable production area |
| Throughput per square metre | Determines revenue density of the facility |
| Utility distribution length | Drives both capital cost and recurring energy loss |
| Expansion bay availability | Determines whether future capacity addition is possible without shutdown |
Source: National Productivity Council guidelines; Ministry of Heavy Industries capital goods sector analysis
Production flow efficiency, asset utilization rates, and cost per unit of output — all three are determined through structured greenfield manufacturing plant layout design consulting India, before a single machine is procured.
What Greenfield Manufacturing Plant Layout Design Actually Includes
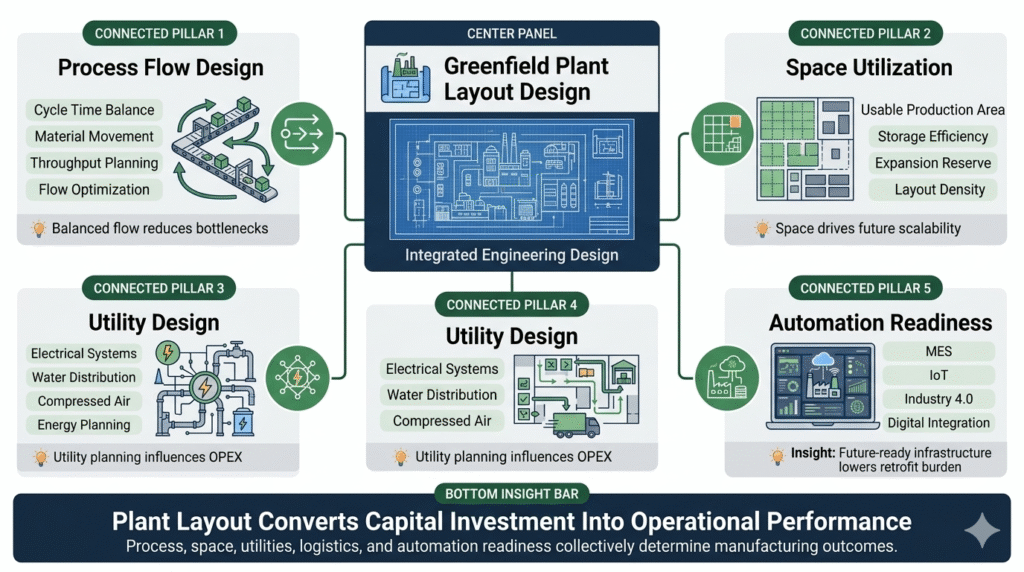
Layout design is not floor planning. It is an integrated engineering exercise across five domains.
1. Process Flow Design
Process flow maps how raw material enters, moves through each production stage, and exits as finished goods.
- Cycle time per station must be balanced within ±5–10% to prevent bottleneck buildup
- Material travel distance should be minimized using systematic layout planning (SLP) methodology
- Throughput modeling identifies the maximum sustainable output before flow constraints limit capacity
- Plants designed without formal flow analysis routinely lose 8–15% of theoretical throughput to internal congestion
2. Space Utilization Planning
Usable production area ratio the share of gross facility area that generates output is a core layout metric.
- World-class plants achieve 68–75% production area utilization
- Poorly planned layouts often drop to 45–55%, wasting expensive industrial land
- Future expansion bays must be integrated at the greenfield stage; retrofitting expansion space costs 3–5× more than designing for it upfront
- Storage efficiency live versus dead storage ratio affects both inventory turns and floor area requirements
3. Utility Design and Distribution
Utility infrastructure electrical substations, compressed air networks, effluent treatment, water supply must follow the process layout, not precede it.
- Compressed air distribution losses above 20–25% of generated volume signal layout-driven over-distribution
- Electrical infrastructure oversized by more than 30% of connected load indicates poor load zoning at the design stage
- Ministry of Heavy Industries guidelines for energy-intensive sectors recommend utility demand modeling before layout finalization
4. Logistics and Material Movement Design
Internal logistics raw material receipt, inter-process movement, finished goods dispatch can account for 12–18% of total manufacturing cost in capital goods and engineering sectors, per National Productivity Council data.
- Aisle width, turning radius, and dock-to-production distance are engineering parameters, not afterthoughts
- Receiving and dispatch zones designed without traffic simulation create permanent operational bottlenecks
5. Automation and Industry 4.0 Readiness
NITI Aayog’s strategy documents for advanced manufacturing emphasize that plants built today must be designed for digital integration from the outset.
- MES (Manufacturing Execution System) connectivity requires conduit and data network infrastructure embedded in the civil structure
- AGV (Automated Guided Vehicle) pathways require minimum 3.5–4.5 m aisle widths and defined floor levelness tolerances
- Sensor and IoT mounting points for machine monitoring must be incorporated at the equipment foundation stage
How Plant Layout Design Impacts Cost
Layout decisions directly drive both CAPEX and OPEX and the cost of getting them wrong compounds over time.
[TABLE IMAGE INSERT HERE] Title: Reactive Plant Layout vs Structured Greenfield Layout
| Cost Dimension | Reactive / Unplanned Layout | Structured Greenfield Layout |
| Civil construction waste | 10–18% over-build on utility runs | Optimized routing; minimal over-build |
| Material handling equipment | Over-specified due to poor flow | Right-sized to actual movement requirement |
| Energy cost per unit output | 15–25% higher (over-distributed utilities) | Demand-zoned; 8–12% lower operating cost |
| Retrofit cost (5-year horizon) | ₹3–5 Cr per major flow change | Near-zero if expansion bays pre-designed |
| Maintenance accessibility | Reactive downtime up to 12–15% of OEE loss | Planned access corridors reduce downtime |
| Future capacity investment | Full production shutdown required | Modular bay addition without disruption |
Engineering indicators based on Ministry of Heavy Industries capital goods sector benchmarks and NPC manufacturing studies
The OPEX burden of a poorly designed layout is not theoretical. Higher internal transport cost, energy waste from oversized utility distribution, and unavoidable production interruptions during retrofit work represent a continuing tax on operational performance for the life of the plant.
How Plant Layout Design Impacts Capacity
Installed capacity and effective capacity are not the same number.
A manufacturing facility rated at 10,000 units per month on paper may deliver only 7,200–8,000 units per month in practice a 20–28% capacity gap due to layout-induced bottlenecks, poor line balance, and WIP accumulation.
Capacity performance indicators directly linked to layout:
- Line balance efficiency: Ratio of theoretical minimum cycle time to actual bottleneck cycle time. Well-designed lines achieve 85–92%; poorly balanced lines often operate at 65–75%
- Installed vs effective capacity ratio: Layout constraints, not machine limitations, are the primary source of the gap in most Indian mid-size manufacturing plants
- Yield loss from congestion: Material handling errors, product damage, and rework rates increase measurably when process layout generates crowded transfer zones
- Shift capacity scalability: A layout that cannot accommodate a second or third shift without operational conflict limits the plant’s output ceiling permanently
According to Ministry of Heavy Industries assessments of the capital goods sector, capacity underutilization in Indian manufacturing facilities is frequently traceable to process flow and space design decisions made during the project development phase not to machine or workforce limitations.
How Plant Layout Design Impacts Operational Efficiency
OEE (Overall Equipment Effectiveness) the composite measure of availability, performance, and quality is the standard metric for manufacturing operational efficiency.
Operational efficiency chain:
- Poor layout → excess material movement → higher WIP → longer lead time → ≥10–15% OEE loss
- Congested transfer zones → handling damage → elevated rework rate → quality cost increase
- Utility over-distribution → higher energy per unit → cost per unit deterioration
- No digital infrastructure readiness → delayed MES adoption → no real-time production visibility
NITI Aayog’s advanced manufacturing strategy notes that Indian plants adopting structured layout design with digital integration achieve measurable improvements in lead time reduction (typically 18–35%) and inventory turns improvement (1.5–2.5× baseline) within 24 months of commissioning.
These are not aspirational outcomes they are engineering results that trace directly back to layout decisions.
Common Greenfield Plant Layout Mistakes
These are the most frequent and costly layout failures observed in new Indian manufacturing facilities.
1. Overbuilt Utility Infrastructure Utilities designed for peak theoretical load without demand zoning. Result: 20–40% of installed capacity permanently stranded; ongoing energy cost premium.
2. Linear Process Flow in Non-Linear Buildings Production sequence designed as a straight line inside an L-shaped or irregular building. Result: forced material backtracking; 15–25% increase in internal transport distance.
3. No Dedicated Future Expansion Bay Expansion capacity not modeled at greenfield stage. Result: when volume grows, structural elements, utility mains, and fire safety systems all require redesign. Retrofit costs typically 3–5× original design cost for the affected area.
4. Receiving and Dispatch at the Same Gate Inbound raw material and outbound finished goods sharing a single gate and apron. Result: permanent traffic conflict; dispatch reliability compromised during peak inbound periods.
5. Automation Infrastructure Absent from Civil Design No conduit, no data trunking, no defined floor flatness tolerance for automation. Result: AGV and MES integration deferred or abandoned; digital upgrade costs multiplied post-construction.
6. No Systematic Layout Planning (SLP) Process Layout finalized based on land shape and building footprint, without formal From-To chart analysis of material flow intensity. Result: high-frequency material movements assigned the longest travel paths.
How IMARC Engineering Supports Greenfield Plant Layout Design
IMARC Engineering delivers greenfield manufacturing plant layout design consulting in India through a structured five-phase process that links engineering analysis to measurable plant performance outcomes.
Phase 1 Site Assessment Evaluation of plot dimensions, orientation, ground conditions, utility availability, and regulatory setback requirements. Output: buildable area envelope with utility entry constraints defined.
Phase 2 Process Mapping Detailed process flow analysis using From-To charts, operation sequence mapping, and material intensity scoring. Output: quantified material flow matrix that drives layout logic not building geometry.
Phase 3 Layout Modeling Multiple layout alternatives generated and evaluated against space utilization, material travel distance, line balance, and expansion flexibility criteria. Output: optimized block layout with measurable performance benchmarks.
Phase 4 Utility Planning Utility demand modeling by zone, integrated with layout to minimize distribution length, enable demand zoning, and right-size installed capacity. Output: utility infrastructure design with load analysis and energy cost modeling.
Phase 5 Execution Roadmap Phased construction and equipment installation sequence aligned with production ramp-up plan and investment drawdown schedule. Output: engineering execution plan with milestones, area readiness criteria, and commissioning sequence.
Every phase produces engineering deliverables with measurable outputs not concept presentations.
Talk to Our Plant Design Team : https://www.imarcengineering.com/contact?service=plant-layout-and-process-flow-design
Future Trends Through 2026 and Beyond
NITI Aayog’s strategy for advanced manufacturing and the Government of India’s National Industrial Corridor Development Programme both signal clear direction for how greenfield plants will be designed and operated going forward.
Smart Factory Integration Plants commissioned under PLI schemes are expected to demonstrate progressive Industry 4.0 adoption. Layout design must embed the physical infrastructure for MES, IoT sensor networks, and real-time production monitoring from Day 1.
Digital Twin Deployment The Ministry of Heavy Industries has referenced digital twin simulation as a core capability for the capital goods sector. Greenfield plant layouts modeled using simulation tools deliver measurably better flow efficiency than those developed through static drafting and produce the digital baseline needed for ongoing operational optimization.
Modular and Scalable Plant Structures The National Industrial Corridor Development Programme promotes standardized industrial infrastructure. New plant designs increasingly adopt modular bay structures that allow capacity addition without structural disruption a layout principle, not an architectural feature.
PM Gati Shakti and Logistics Integration The PM Gati Shakti National Master Plan connects manufacturing zones to multimodal logistics infrastructure. Plant layout design must account for external logistics linkage gate orientation, truck apron sizing, and dock-to-production flow as a design parameter, not an afterthought.
Conclusion
Greenfield plant layout design is not a design activity that follows investment decisions. It is a strategic decision that determines what those investments actually deliver.
Summary of measurable impact:
✓ Cost Impact Layout decisions drive 15–25% of OPEX through utility distribution efficiency, material handling cost, and maintenance accessibility. Retrofit costs for layout corrections run 3–5× original design cost.
✓ Capacity Impact Layout-induced bottlenecks and poor line balance reduce effective capacity by 20–28% below installed capacity. The gap is recoverable only through costly redesign.
✓ Efficiency Impact OEE losses of 10–15% traceable to layout-driven material flow congestion and transfer zone design are avoidable at the greenfield stage.
✓ Expansion Readiness Plants designed without formal expansion modeling face full production shutdowns for capacity addition. Pre-designed expansion bays eliminate this constraint.✓ Strategic Recommendation For any manufacturing investment in India’s PLI pipeline, Industrial Corridor land parcels, or private greenfield projects, layout design must be treated as a pre-CAPEX engineering investment, not a post-CAPEX construction activity.
Contact Us:
IMARC Engineering
Phone: +91-120-433-0800
Email: sales@imarcengineering.com
India: C-130, Sector 2, Noida, Uttar Pradesh 201301
LinkedIn: https://www.linkedin.com/showcase/imarc-engineering/
About the Author